Using Chrome DevTools To Hunt Javascript Memory Leaks
In this section we will learn how to use the Chrome DevTools to identify javascript memory leaks in your code by making use of these 3 developer tools –
- Timeline View
- Heap Memory Profiler
- Allocation Timeline (or Allocation profiler)
First open any code editor of your choice and create an HTML doc with the code below and open it in chrome browser
<script>
var foo = [];
function grow() {
foo.push(new Array(1000000).join('foo'));
if (running)
setTimeout(grow, 2000);
}
var running = false;
$('#leak-button').click(function () {
running = true;
grow();
});
$('#stop-button').click(function () {
running = false;
});
</script>
When the ‘Start’ button is clicked, it will call the grow() function which will append a string 1000000 characters long. The variable foo is a global variable which will not be garbage collected as it is being called by the grow() function recursively every second. Clicking the ‘Stop’ button will change the running flag to false to stop the recursive function call. Every time the function call ends, the garbage collector will free up memory but the variable foo will not be collected, leading to a memory leak scenario.
1. Timeline View
The first Chrome Developer Tool that we will put to use for identifying memory leaks is called ‘Timeline’. Timeline is a centralized overview of your code’s activity which helps you to analyze where time is spent on loading, scripting, rendering etc. You can visualize your memory leaks using the timeline recording option and compare memory usage data before and after the garbage collection.
- Step1: Open our HTML doc in Chrome browser and press Ctrl+Shift+I to open Developer Tools.
- Step2: Click on performance tab to open timeline overview window. Click Ctrl+E or click the record button to start timeline recording. Open your webpage and click on ‘start button’.
- Step3: wait for 15 seconds and proceed to click ‘Stop button’ on your webpage. Wait for 10 seconds and click on garbage icon to the right to manually trigger garbage collector and stop the recording.
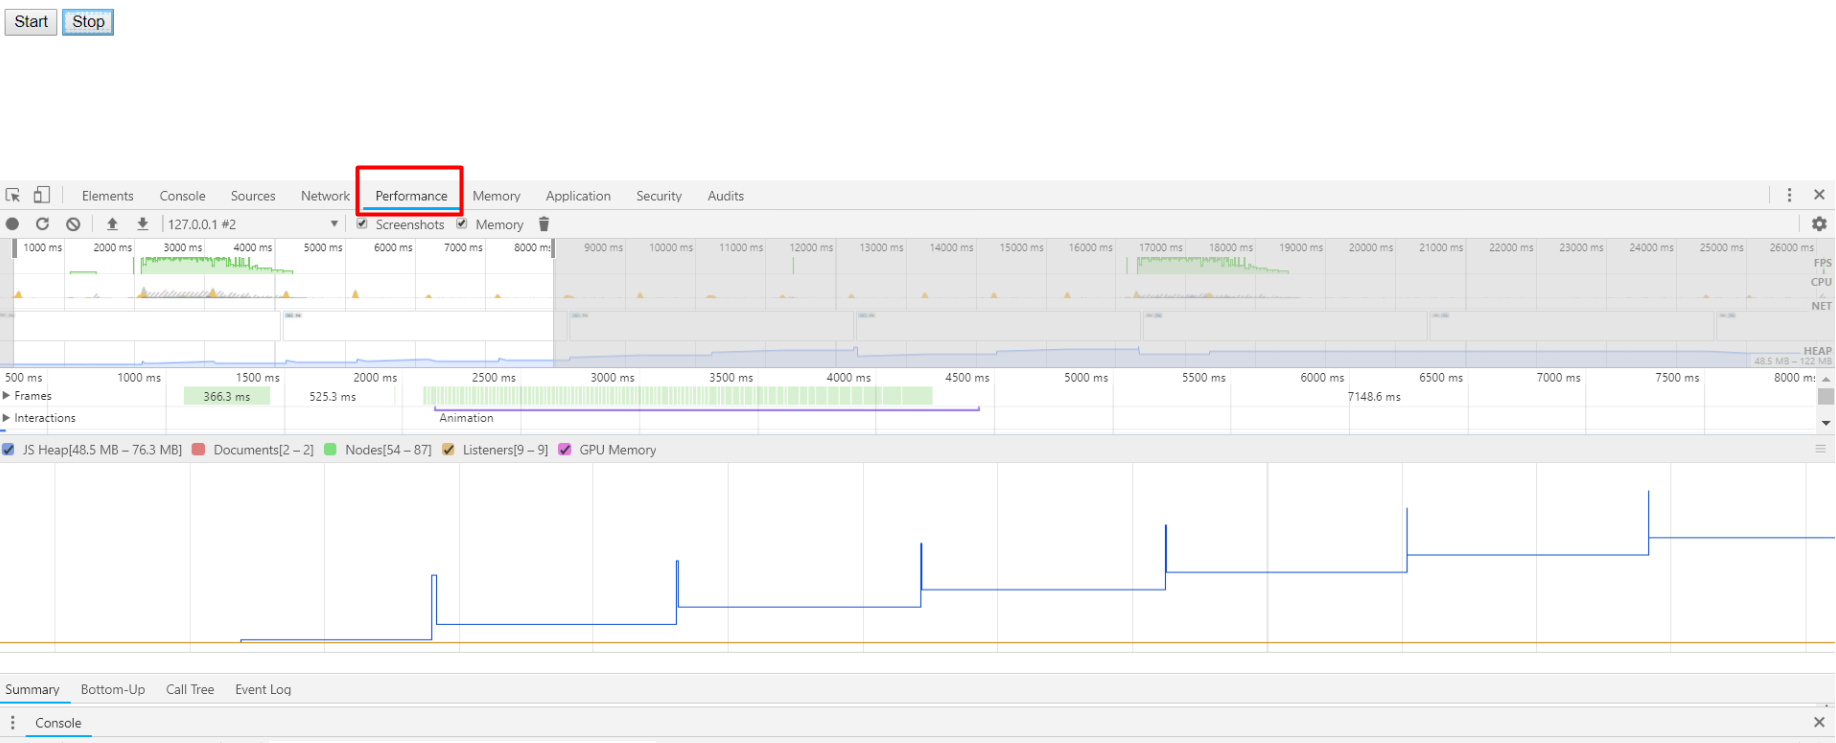
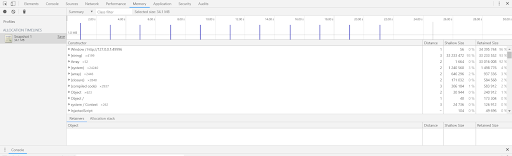
As you can see in the screenshot above, memory usage is going up with time. Every spike indicates when the grow function is called. But after the function execution ends, garbage collector clears up most of the garbage except the global foo variable. It keeps on increasing more memory and even after ending the program, the memory usage in the end did not drop to initial state.
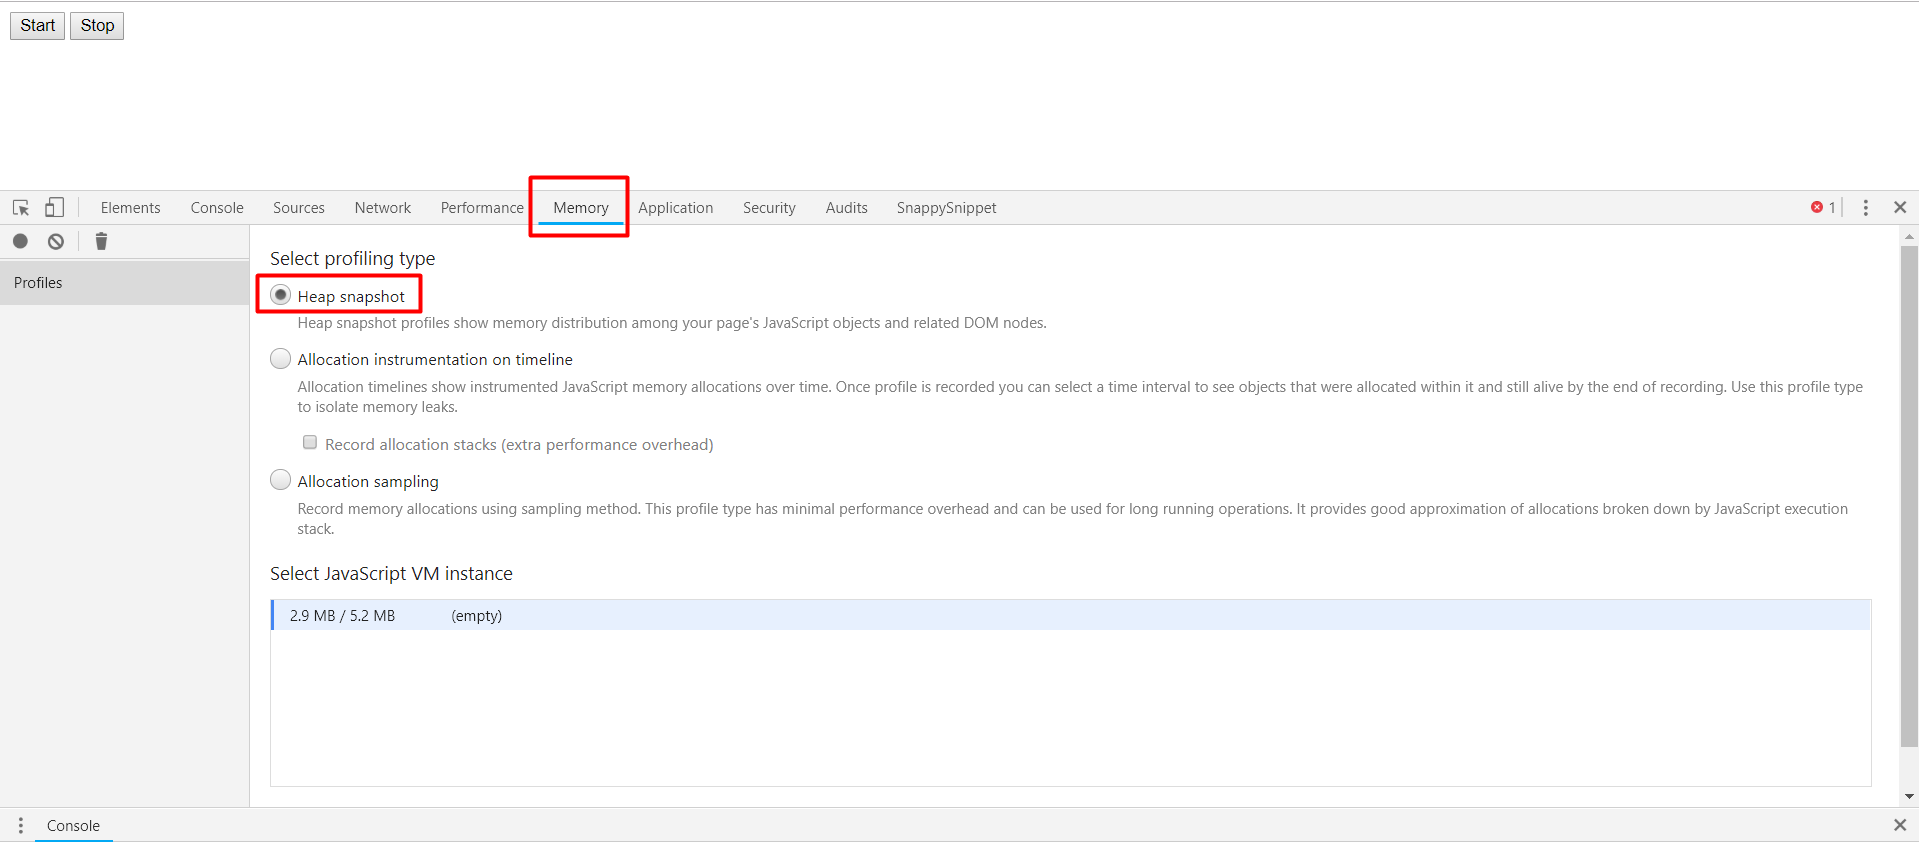
2. Heap Memory Profiler
The ‘Heap Memory Profiler’ shows memory distribution by JavaScript objects and related DOM nodes. Use it to take heap snapshots, analyze memory graphs, compare snapshot data, and find memory leaks.
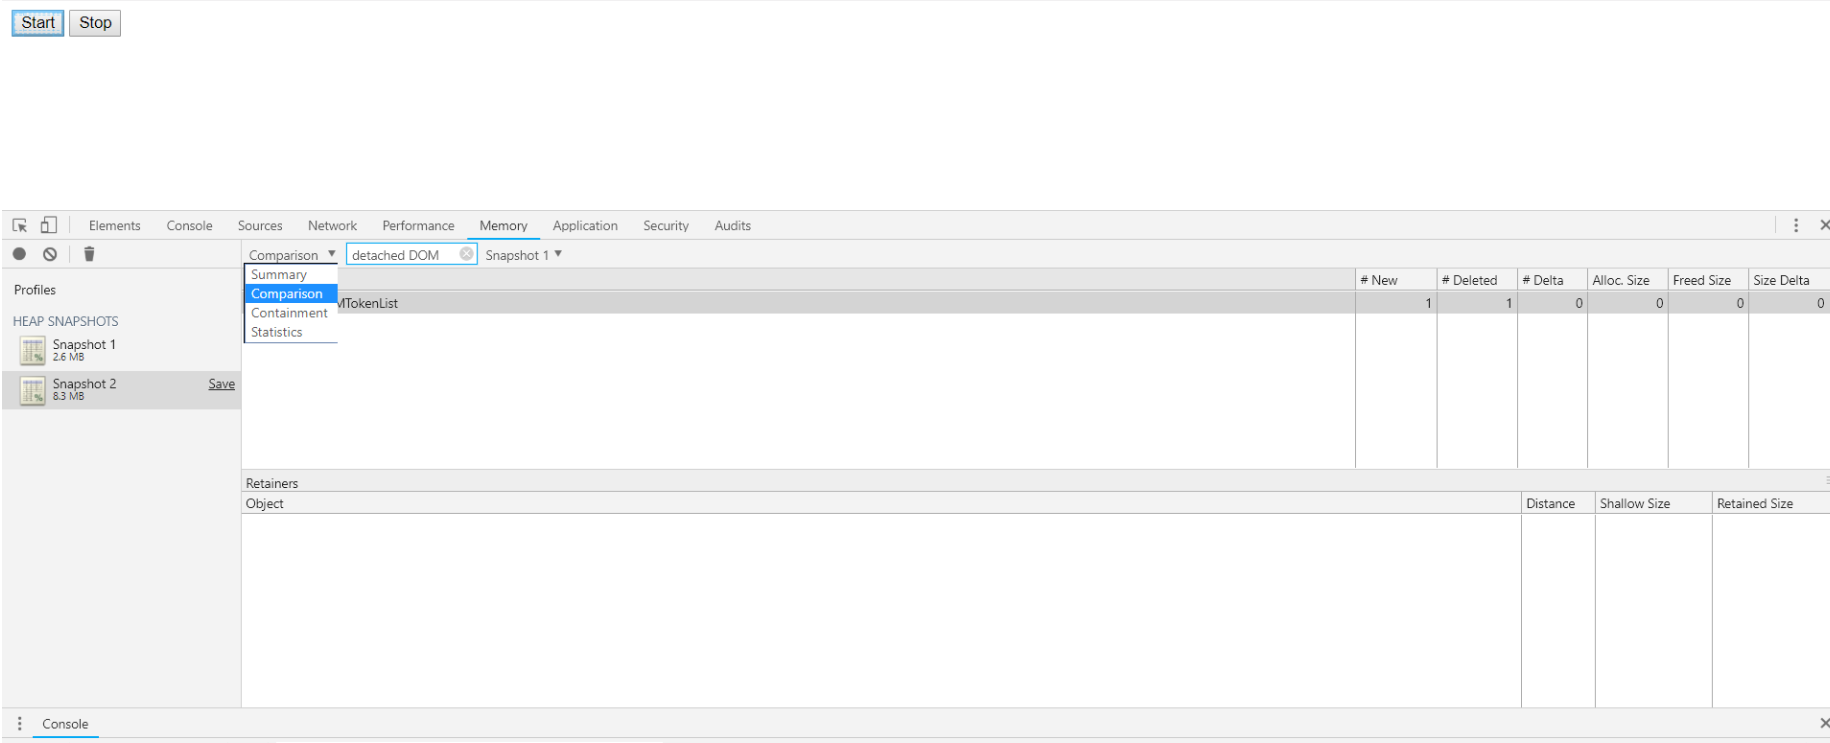
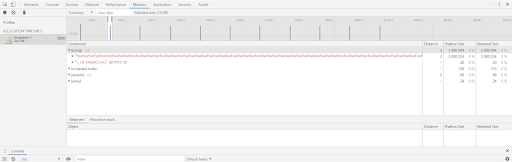
3.) Allocation Timeline/Profiler
The allocation profiler combines the snapshot information of the heap memory profiler with the incremental tracking of the Timeline panel. The tool takes heap snapshots periodically throughout the recording (as frequently as every 50 ms!) and one final snapshot at the end of the recording. Study the generated graph for suspicious memory allocation.
In newer versions of chrome, ‘Profiles’ tab has been removed. You can now find allocation profiler tool inside the memory panel rather than the profiles panel.
- Step1 : Press Ctrl+Shift+I to open Chrome Dev Tools and click on memory panel.
- Step2 : Select ‘Allocation Instrumentation on timeline’ option and click start.
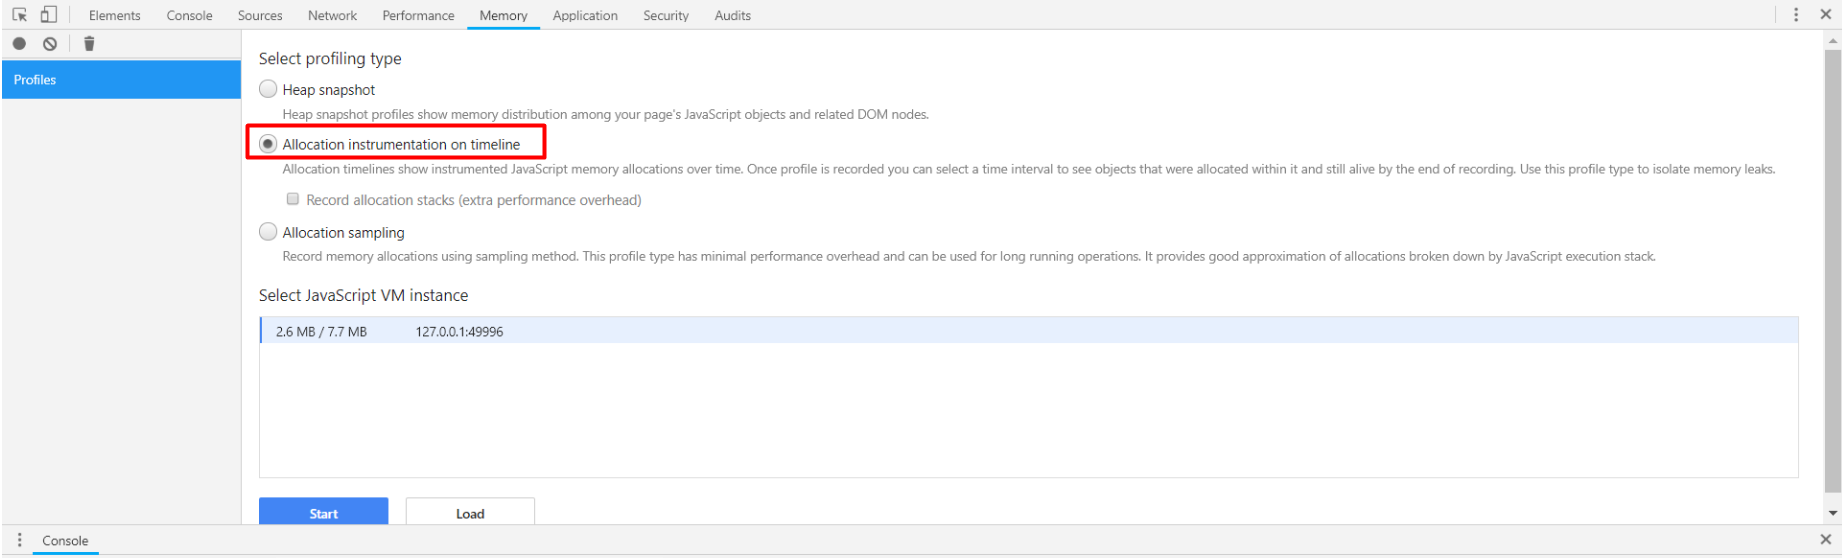
- Step 3: Click and record and wait for allocation profiler to automatically take snapshots in a periodical manner. Analyse the generated graph for suspicious memory allocation.
Removing the memory leak by modifying our code
Now that we have successfully used chrome developer tools to identify the memory leak in our code, we need to tweak our code to eliminate this leak.
As discussed earlier in the ’causes of memory leaks’ section, we saw how global variables are never disposed of by garbage collectors especially when they are being recursively called by a function. We have 3 ways in which we can modify our code –
- Set the global variable foo to null after it is no longer needed.
- Use ‘let’ instead of ‘var’ for variable foo declaration. Let has a block scope unlike var. It will be garbage collected.
- Put the foo variable and the grow() function declarations inside the click event handler.
<script>
var running = false;
$('#leak-button').click(function () {
/* Variable foo and grow function are now decalred inside the click event handler. They no longer have global scope. They now have local scope and therefore will not lead to memory leak*/
var foo = [];
function grow() {
foo.push(new Array(1000000).join('foo'));
if (running)
setTimeout(grow, 2000);
}
running = true;
grow();
});
$('#stop-button').click(function () {
running = false;
});
</script>
Conclusion
It’s nearly impossible to completely avoid javascript memory leaks, especially in large applications. A minor leak will not affect an application’s performance in any significant manner. Moreover, modern browsers like Chrome and Firefox armed with advanced garbage collector algorithms do a pretty good job in eliminating memory leaks automatically. This doesn’t mean that a developer must be oblivious to efficient memory management. Good coding practices go a long way in curbing any chance of leaks right from the development phase to avoid complications later. Use Chrome Developer tools to identify as many javascript memory leaks as you can to deliver an amazing user experience free from any freezes or crashes.
 ) when you're done.