Showing posts with label Java Script. Show all posts

Saturday, June 6, 2020

Identify JS heap memory leaks with Allocation Timelines

Identify JS heap memory leaks with Allocation Timelines

The Allocation Timeline is another tool that can help you track down memory leaks in your JS heap.

To demonstrate the Allocation Timeline consider the following code:

var x = [];

function grow() {
  x
.push(new Array(1000000).join('x'));
}

document
.getElementById('grow').addEventListener('click', grow);

Every time that the button referenced in the code is pushed, a string of one million characters is added to the x array.

To record an Allocation Timeline, open DevTools, go to the Profiles panel, select the Record Allocation Timeline radio button, press the Start button, perform the action that you suspect is causing the memory leak, and then press the stop recording button (stop recording button) when you're done.

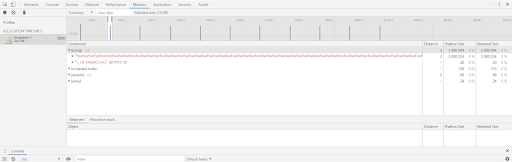
As you're recording, notice if any blue bars show up on the Allocation Timeline, like in the screenshot below.

new allocations

Those blue bars represent new memory allocations. Those new memory allocations are your candidates for memory leaks. You can zoom on a bar to filter the Constructor pane to only show objects that were allocated during the specified timeframe.

zoomed allocation timeline

Expand the object and click on its value to view more details about it in the Object pane. For example, in the screenshot below, by viewing the details of the object that was newly allocated, you'd be able to see that it was allocated to the x variable in the Window scope.

object details

Discover detached DOM tree memory leaks with Heap Snapshots

Discover detached DOM tree memory leaks with Heap Snapshots

A DOM node can only be garbage collected when there are no references to it from either the page's DOM tree or JavaScript code. A node is said to be "detached" when it's removed from the DOM tree but some JavaScript still references it. Detached DOM nodes are a common cause of memory leaks. This section teaches you how to use DevTools' heap profilers to identify detached nodes.

Here's a simple example of detached DOM nodes.

var detachedTree;

function create() {
 
var ul = document.createElement('ul');
 
for (var i = 0; i < 10; i++) {
   
var li = document.createElement('li');
    ul
.appendChild(li);
 
}
  detachedTree
= ul;
}

document
.getElementById('create').addEventListener('click', create);

Clicking the button referenced in the code creates a ul node with ten li children. These nodes are referenced by the code but do not exist in the DOM tree, so they're detached.

Heap snapshots are one way to identify detached nodes. As the name implies, heap snapshots show you how memory is distributed among your page's JS objects and DOM nodes at the point of time of the snapshot.

To create a snapshot, open DevTools and go to the Profiles panel, select the Take Heap Snapshot radio button, and then press the Take Snapshot button.

take heap snapshot

The snapshot may take some time to process and load. Once it's finished, select it from the lefthand panel (named HEAP SNAPSHOTS).

Type Detached in the Class filter textbox to search for detached DOM trees.

filtering for detached nodes

Expand the carats to investigate a detached tree.

investigating detached tree

Nodes highlighted yellow have direct references to them from the JavaScript code. Nodes highlighted red do not have direct references. They are only alive because they are part of the yellow node's tree. In general, you want to focus on the yellow nodes. Fix your code so that the yellow node isn't alive for longer than it needs to be, and you also get rid of the red nodes that are part of the yellow node's tree.

Click on a yellow node to investigate it further. In the Objects pane you can see more information about the code that's referencing it. For example, in the screenshot below you can see that the detachedTree variable is referencing the node. To fix this particular memory leak, you would study the code that uses detachedTree and ensure that it removes its reference to the node when it's no longer needed.

investigating a yellow node

Using Chrome DevTools To Hunt Javascript Memory Leaks

Using Chrome DevTools To Hunt Javascript Memory Leaks

In this section we will learn how to use the Chrome DevTools to identify javascript memory leaks in your code by making use of these 3 developer tools –

  1. Timeline View
  2. Heap Memory Profiler
  3. Allocation Timeline (or Allocation profiler)

First open any code editor of your choice and create an HTML doc with the code below and open it in chrome browser

<script>

       var foo = [];

       function grow() {

           foo.push(new Array(1000000).join('foo'));

           if (running)

               setTimeout(grow, 2000);

       }

       var running = false;


       $('#leak-button').click(function () {

           running = true;

           grow();

       });


       $('#stop-button').click(function () {

           running = false;

       });

   </script>


When the ‘Start’ button is clicked, it will call the grow() function which will append a string 1000000 characters long. The variable foo is a global variable which will not be garbage collected as it is being called by the grow() function recursively every second. Clicking the ‘Stop’ button will change the running flag to false to stop the recursive function call. Every time the function call ends, the garbage collector will free up memory but the variable foo will not be collected, leading to a memory leak scenario.

1. Timeline View

The first Chrome Developer Tool that we will put to use for identifying memory leaks is called ‘Timeline’. Timeline is a centralized overview of your code’s activity which helps you to analyze where time is spent on loading, scripting, rendering etc. You can visualize your memory leaks using the timeline recording option and compare memory usage data before and after the garbage collection.

  • Step1: Open our HTML doc in Chrome browser and press Ctrl+Shift+I to open Developer Tools.
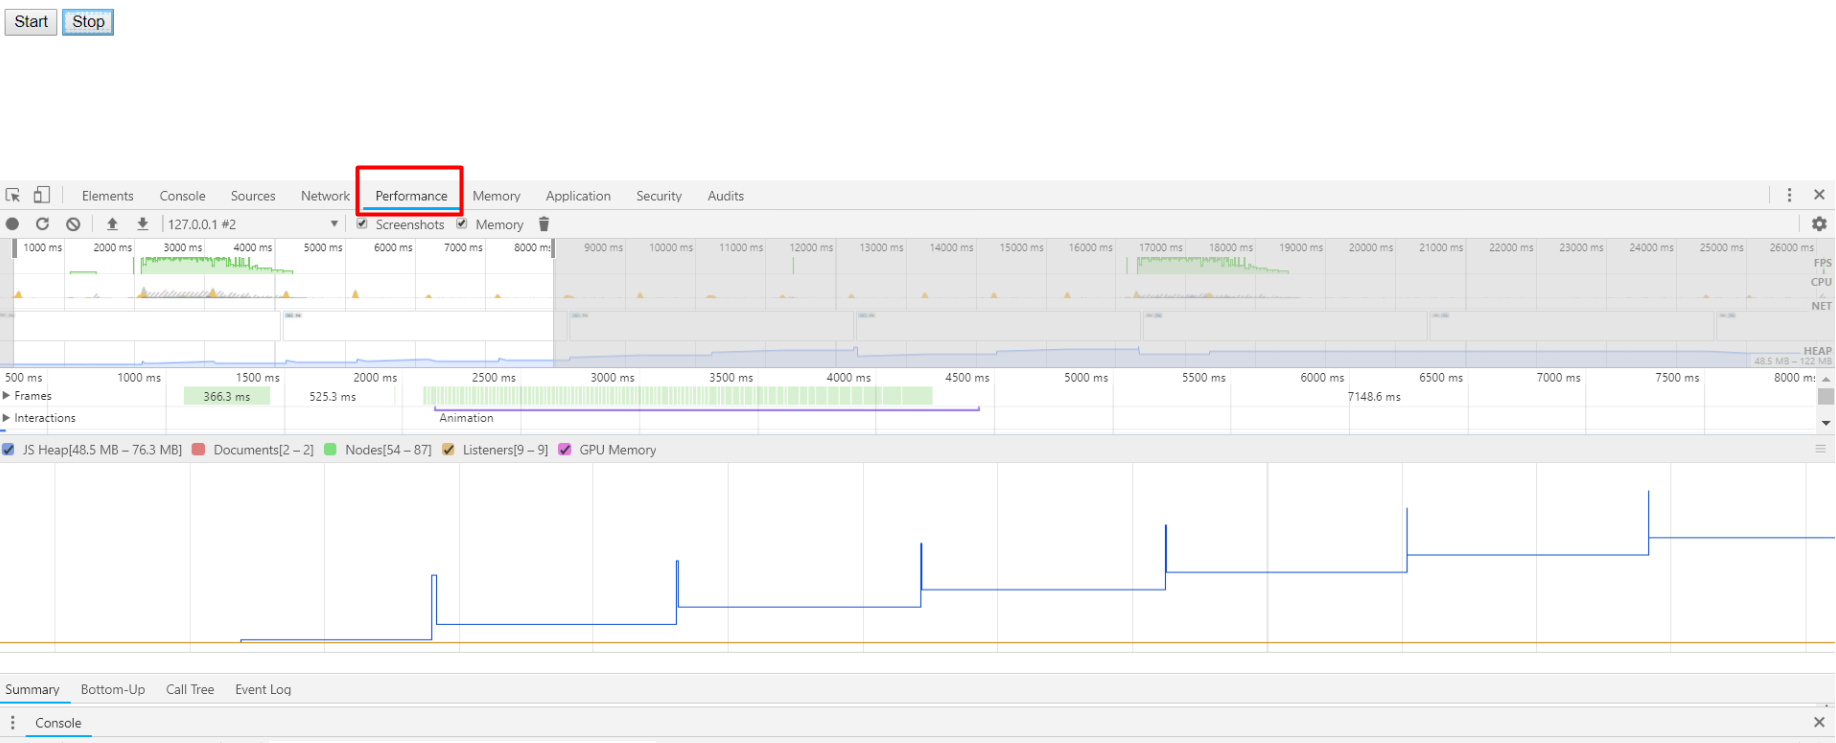
  • Step2: Click on performance tab to open timeline overview window. Click Ctrl+E or click the record button to start timeline recording. Open your webpage and click on ‘start button’.
  • Step3: wait for 15 seconds and proceed to click ‘Stop button’ on your webpage. Wait for 10 seconds and click on garbage icon to the right to manually trigger garbage collector and stop the recording.
a

As you can see in the screenshot above, memory usage is going up with time. Every spike indicates when the grow function is called. But after the function execution ends, garbage collector clears up most of the garbage except the global foo variable. It keeps on increasing more memory and even after ending the program, the memory usage in the end did not drop to initial state.

2. Heap Memory Profiler

The ‘Heap Memory Profiler’ shows memory distribution by JavaScript objects and related DOM nodes. Use it to take heap snapshots, analyze memory graphs, compare snapshot data, and find memory leaks.

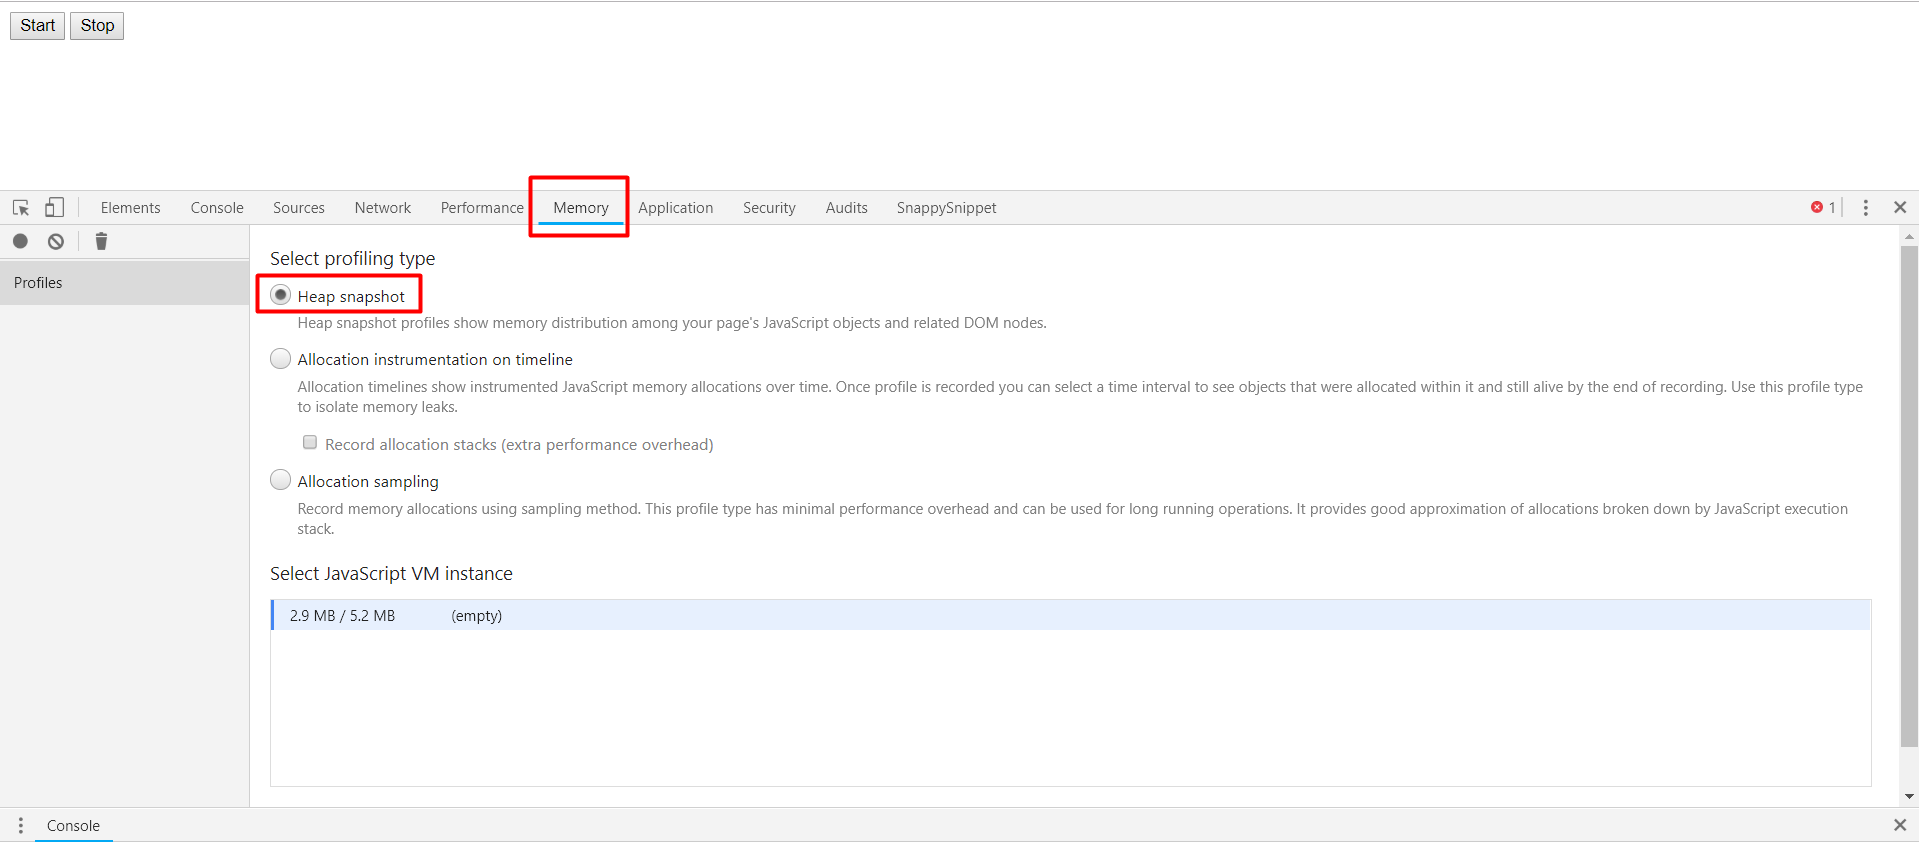
  • Step1 : Press Ctrl+Shift+I to open Chrome Dev Tools and click on memory panel.
  • Step2 : Select ‘Heap Snapshot’ option and click start.
  • a

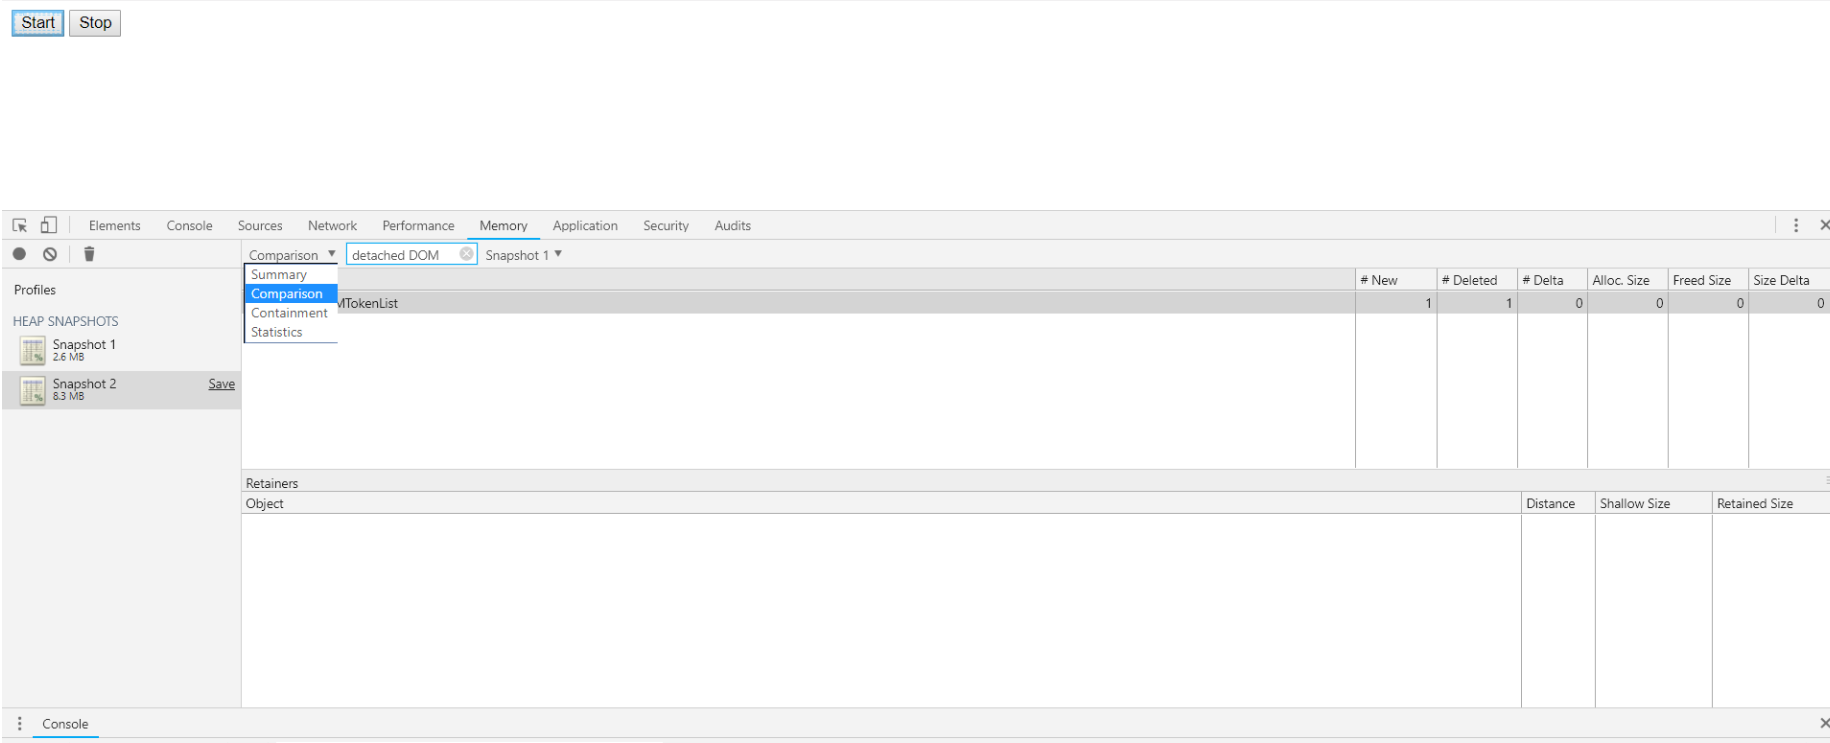
  • Step3 : Click the start button on your webpage and select the record heap snapshot button at top left under memory panel. Wait for 10-15 seconds and click close button on your webpage. Proceed ahead and take a second heap snapshot.

    a

  • Step4 : select ‘comparison’ option from the drop down instead of ‘summary’ and search for detached DOM elements. This will help to identify Out of DOM references. There are none in our example case(the memory leak in our examle is due to global variable)

3.) Allocation Timeline/Profiler

The allocation profiler combines the snapshot information of the heap memory profiler with the incremental tracking of the Timeline panel. The tool takes heap snapshots periodically throughout the recording (as frequently as every 50 ms!) and one final snapshot at the end of the recording. Study the generated graph for suspicious memory allocation.

In newer versions of chrome, ‘Profiles’ tab has been removed. You can now find allocation profiler tool inside the memory panel rather than the profiles panel.

  • Step1 : Press Ctrl+Shift+I to open Chrome Dev Tools and click on memory panel.
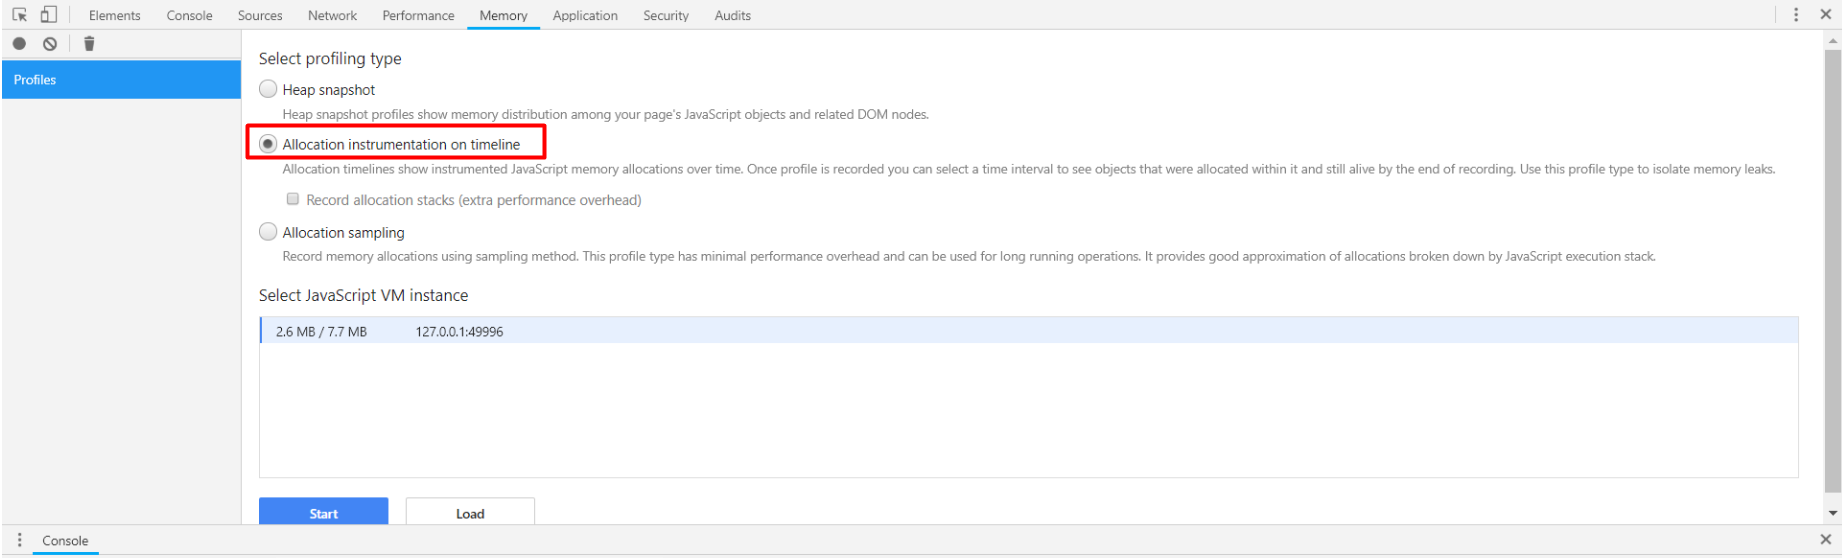
  • Step2 : Select ‘Allocation Instrumentation on timeline’ option and click start.
  • a

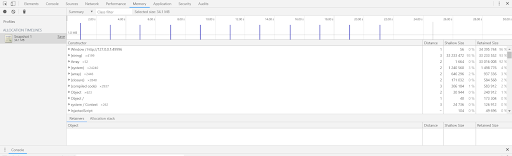
  • Step 3: Click and record and wait for allocation profiler to automatically take snapshots in a periodical manner. Analyse the generated graph for suspicious memory allocation.
  • a

    a

Removing the memory leak by modifying our code

Now that we have successfully used chrome developer tools to identify the memory leak in our code, we need to tweak our code to eliminate this leak.

As discussed earlier in the ’causes of memory leaks’ section, we saw how global variables are never disposed of by garbage collectors especially when they are being recursively called by a function. We have 3 ways in which we can modify our code –

  1. Set the global variable foo to null after it is no longer needed.
  2. Use ‘let’ instead of ‘var’ for variable foo declaration. Let has a block scope unlike var. It will be garbage collected.
  3. Put the foo variable and the grow() function declarations inside the click event handler.
 <script>
       var running = false;

       $('#leak-button').click(function () {
           /* Variable foo and grow function are now decalred inside the click event handler. They no longer have global scope. They now have local scope and therefore will not lead to memory leak*/
           var foo = [];

           function grow() {
               foo.push(new Array(1000000).join('foo'));
               if (running)
                   setTimeout(grow, 2000);
           }
           running = true;
           grow();
       });

       $('#stop-button').click(function () {
           running = false;
       });
   </script>

Conclusion

It’s nearly impossible to completely avoid javascript memory leaks, especially in large applications. A minor leak will not affect an application’s performance in any significant manner. Moreover, modern browsers like Chrome and Firefox armed with advanced garbage collector algorithms do a pretty good job in eliminating memory leaks automatically. This doesn’t mean that a developer must be oblivious to efficient memory management. Good coding practices go a long way in curbing any chance of leaks right from the development phase to avoid complications later. Use Chrome Developer tools to identify as many javascript memory leaks as you can to deliver an amazing user experience free from any freezes or crashes.

Monday, April 1, 2019

JsUnit is a Unit Testing framework for client-side (in-browser) JavaScript

JsUnit is a Unit Testing framework for client-side (in-browser) JavaScript. It is essentially a port of JUnitto JavaScript. Also included is a platform for automating the execution of tests on multiple browsers and mutiple machines running different OSs. Its development began in January 2001.

Download the jsunit
http://www.jsunit.net/

Test Procedure

Step 1 : run(double click) testRunner.html which is located in the  jsunit/testRunner.html.


Step 2 : Need to add the test case html page (already this frame work has some test html files in the location : jsunit/tests/*)and click on the run button from the opened testRunner. (in my case, Google Chrome is not showing me Run, Stop buttons. So, I have tested with FireFox Browser and Internet Explorer).


Documenting your javascript code like a pro, setting up JSdoc

Please find the following link ,
Explains clearly about the documentation of javascript code.

https://www.youtube.com/watch?v=Yl6WARA3IhQ

https://github.com/JSCasts-episodes/ep1-jsdoc


Thursday, November 8, 2018

Load JS File dynamically from JSP file.

function loadJSfile(language) {
var fileref = document.createElement('script')
fileref.setAttribute("type", "text/javascript");
var theURL = window.location.href;
var arr = theURL.split("/");
var result = arr[0] + "//" + arr[2] + "/" + arr[3];
var thePath ="/resources/json_messages/messageJson_"+language+".js";
var theMessageFileURL = result + thePath;
$.ajax({
url : theMessageFileURL,
type : 'HEAD',
async : false,
error : function() {
//language message file not exists
loadJSfile("en");
},
success : function() {
//language message file exists
fileref.setAttribute("src", theMessageFileURL)
if (typeof fileref != "undefined")
document.getElementsByTagName("head")[0]
.appendChild(fileref)
}
});
}

loadJSfile("${pageContext.response.locale}"); //dynamically load and add this .js file

Wednesday, April 25, 2018

starts(Interval dynamically) and stop

<!DOCTYPE html>
<html>
<body>

<p>A script on this page starts(Interval dynamically) and stop</p>

<p id="demo"></p>
<input id="intervalValue"type="text">
<button onclick="myStartFunction()">Start</button>
<button onclick="myStopFunction()">Stop </button>

<script>

var myVar;
function myTimer() {
   for(var index=0;index<5;index++){
     console.log(index); 
}
 }
function myStopFunction() {
    clearInterval(myVar);
}
function myStartFunction(){
    var theIntervalValue =  document.getElementById("intervalValue");
myVar = setInterval(function(){ myTimer() }, theIntervalValue);
}
</script>

</body>
</html>

A script on this page starts(Interval dynamically) and stop

Thursday, January 18, 2018

jquery.templates

<html xmlns="http://www.w3.org/1999/xhtml" >
<head id="Head1" runat="server">
    <title>jQuery Templates – tmpl(), template() and tmplItem()</title>
    <script src="http://ajax.aspnetcdn.com/ajax/jQuery/jquery-1.4.4.min.js" type="text/javascript"></script>
    <script src="http://ajax.aspnetcdn.com/ajax/jquery.templates/beta1/jquery.tmpl.min.js" type="text/javascript"></script>
    <script language="javascript" type="text/javascript">
        $(function () {
            var attendees = [
                { Name: "Hajan", Surname: "Selmani", speaker: true, phones: [070555555, 071888999, 071222333] },
                { Name: "Darko", Surname: "Milevski", phones: [070555555, 071888999, 071222333] },
                { Name: "Ljubomir", Surname: "Zivanovic", phones: [070555555, 071222333] },
                { Name: "Mile", Surname: "Grujovski", phones: [070555555, 071888999, 071222333] },
                { Name: "Ivan", Surname: "Acev", phones: [071888999, 071222333] },
                { Name: "Dejan", Surname: "Dimitrovski", speaker: true, phones: [070555555, 071222333] }
                ];

var colleges = [
                { College: "Narayana"},
                { College: "Chaitanya"},
{ College: "Balaji"}
                ];

            $("#attendeesTemplate").template("listAttendees"); //compiling the template to named listAttendees

$("#collegesTemplate").template("listColleges"); //compiling the template to named listAttendees

            $.tmpl("listAttendees", attendees).appendTo("#attendees"); //using compiled template
            //$("#attendeesTemplate").tmpl(attendees).appendTo("#attendees");

            $("#findSpeaker").click(function () {
                var speakers = $("li.speaker:last").tmplItem();
                var speaker = speakers.data;
                var htmlElement = speakers.nodes;
                $(htmlElement).css("background-color", "yellow");
            });

            $("#addNew").click(function () {
                var sps = false;
                if ($("#speaks").attr("checked")) sps = true;

                attendees.push({ Name: $("#name").val(), Surname: $("#surname").val(), speaker: sps });
                $("#attendees").html("");
                $.tmpl("listAttendees", attendees).appendTo("#attendees");
            });
$("#addNew").click(function () {
                var sps = false;
                if ($("#speaks").attr("checked")) sps = true;

                attendees.push({ Name: $("#name").val(), Surname: $("#surname").val(), speaker: sps });
                $("#attendees").html("");
                $.tmpl("listAttendees", attendees).appendTo("#attendees");
            });

$("#repalceNew").click(function () { 
                $("#attendees").html("");
                $.tmpl("listColleges", colleges).appendTo("#attendees");
            });
        });
    </script>

    <script id="attendeesTemplate" type="text/html">
            {{if speaker}}
                <li class="speaker">${Name} ${Surname} ${phones}
                (<font color="green">speaker</font>)
                </li>
            {{else}}
                <li class="attendee">${Name} ${Surname}
                    (attendee)
                </li>
            {{/if}}       
    </script>
<script id="collegesTemplate" type="text/html">
            <li>
${College}
           </li>
    </script>
</head>
<body>
<div id="content">
    <div id="list" style="width:300px;">
        <ol id="attendees"></ol>
    </div>
    <div id="addForm">
        Name: <input id="name" type="text" style="display:inline;" /> 
        Surname: <input id="surname" type="text" />
        Speaker: <input id="speaks" type="checkbox" /> <br />
        <a id="addNew" href="#">Add New</a><br />
<a id="repalceNew" href="#">Replace Some Data</a><br />
    </div>           
    <a id="findSpeaker" href="#">HighLight Last Speaker</a>
</div>
</body>
</html>

IP Address Validation

<!DOCTYPE html>
<html>
<body>

<form id="frm1" name="form1" action="/action_page.php">
  IP Address: <input id="ipAddress"type="text" name="ipAddress" value="">
  <br>
  Host Name: <input id="hostName"type="text" name="hostName" value="">
</form>

<button onclick="ValidateIPaddress()">ValidateIPAddress</button>
<button onclick="ValidateHostName()">ValidateHostName</button>


<p>
IP Address Check :: Checks::
Example of VALID IP address

115.42.150.37
192.168.0.1
110.234.52.124
Example of INVALID IP address

210.110 – must have 4 octets
255 – must have 4 octets
y.y.y.y – only digits are allowed
255.0.0.y – only digits are allowed
666.10.10.20 – octet number must be between [0-255]
4444.11.11.11 – octet number must be between [0-255]
33.3333.33.3 – octet number must be between [0-255]
</p>
<p>
Hoste Name :: Checks::
!jkfd.com
@mfd.com
google.com
jkfd@jkfdkd.com
test.foob.ar
</p>

<script>

function ValidateIPaddress() { 
   var ipAddress = document.getElementById("ipAddress").value;
   console.log(ipAddress);
  if (/^(([0-9]|[1-9][0-9]|1[0-9]{2}|2[0-4][0-9]|25[0-5])\.){3}([0-9]|[1-9][0-9]|1[0-9]{2}|2[0-4][0-9]|25[0-5])$/.test(ipAddress)) { 
    return (true) 
  } 
  alert("You have entered an invalid IP address!") 
  return (false) 
}

function ValidateHostName() { 
   var hostName = document.getElementById("hostName").value;
   console.log(hostName);
  if (/^(([a-zA-Z]|[a-zA-Z][a-zA-Z0-9\-]*[a-zA-Z0-9])\.)*([A-Za-z]|[A-Za-z][A-Za-z0-9\-]*[A-Za-z0-9])$/.test(hostName)) { 
  //^(([a-zA-Z]|[a-zA-Z][a-zA-Z0-9\-]*[a-zA-Z0-9])\.)*([A-Za-z]|[A-Za-z][A-Za-z0-9\-]*[A-Za-z0-9])$
  ///^(([a-zA-Z0-9]|[a-zA-Z0-9][a-zA-Z0-9\-]*[a-zA-Z0-9])\.)*([A-Za-z0-9]|[A-Za-z0-9][A-Za-z0-9\-]*[A-Za-z0-9])$/
    return (true) 
  } 
  alert("You have entered an invalid Host Name !") 
  return (false) 
}


</script>

</body>
</html>

Zoom In and Zoom Out Functionality on High Charts

events:{
                                            afterSetExtremes:function() {
                                                var singleGraphMinMaxTableData=[];
                                             for(z=0;z<singleGraphResponeFromAPIUserWhereRequired.length;z++){
                                                var minAxis = this.min,
                                                    maxAxis = this.max,
                                                    points = this.chart.series[z].points;
                                                  /*   min = points[z].options.y,
                                                    max = points[z].y; */
                                                      //console.log("series ::"+JSON.stringify(this.chart.series[z].name));
                                                var localArray=[];
                                                $.each(points, function(i, p) {
                                                    if(p.x >= minAxis && p.x <= maxAxis) {
                                                            localArray.push(p.y);
                                                   }
                                                });
                                                var min= Math.min.apply(Math, localArray);
                                                var max= Math.max.apply(Math, localArray);
                                                var name =this.chart.series[z].name;
                                                      var zoneAxis =this.chart.series[z].zoneAxis;
                                                var splittedName=name.split("/");
                                                singleGraphMinMaxTableData[z]= new Array(splittedName[0],zoneAxis,splittedName[splittedName.length-1],min,max);
                                                }
                                            $('#singleGraphLineMinMaxTable').DataTable( {
                                                        data: singleGraphMinMaxTableData,
                                                        "bDestroy":true,
                                                        columns: [
                                                            { title: "<fmt:message key="lbl.text.name"/>" },
                                                            { title: "<fmt:message key="lbl.text.type"/>" },
                                                            { title: "<fmt:message key="lbl.text.selected"/>" },
                                                            { title: "<fmt:message key="lbl.text.min"/>" },
                                                            { title: "<fmt:message key="lbl.text.max"/>" }
                                                        ]
                                                    } );
                                            //console.log("singleGraphMinMaxTableData-->"+JSON.stringify(singleGraphMinMaxTableData));
                                            }

                                        },

How to force browser to download file?

Date format in C3Graph

axis: {
                                 x: {
                                  type: 'timeseries',
                                    tick: {
                                         format: '%Y-%m-%d',// '%I-%M',
                                        culling: false,
                                        count:25,
                                        rotate: 60
                                     },
                                   /*
                                                       * tick: { values: xAxisTickValues, format:
                                                       * function (x) { return formatDateForGraph(x); },
                                                       * rotate: 60 },
                                                       */
                                    
                                     label: {
                                         text: messageObject.robotView.graph.xAxisValue/*,
                                         position: 'outer-middle'*/  }
                               
                                 },
                                 y: {
                                   max: 2.5,
                                      min: 0,
                                     label: {
                                         text: messageObject.robotView.graph.yAxisValue,
                                         position: 'outer-top'}
                                 }
                                
                             },
                                       tooltip: {
                                                  format: {
                                                    title: function (x) {
                                                       return getFormattedRobotViewDate(x) }
                                                  }
                                                }
                              
                                   });


function getFormattedRobotViewDate(date) {
                               var d = new Date(date),
                                   month = '' + (d.getMonth() + 1),
                                   day = '' + d.getDate(),
                                   year = d.getFullYear(),
                                   hour = ''+d.getHours(),
                                   minutues = ''+d.getMinutes();
                                   /*seconds = ''+d.getSeconds(),
                                   milliSeconds=''+d.getMilliseconds();*/

                                   if (month.length < 2) month = '0' + month;
                                   if (day.length < 2) day = '0' + day;
                                   if(hour.length<2) hour='0'+hour;
                                   if(minutues.length<2) minutues='0'+minutues;
                                   /*if(seconds.length<2) seconds='0'+seconds;
                                   if(milliSeconds.length==1) milliSeconds ='00'+milliSeconds;
                                   if(milliSeconds.length==2) milliSeconds ='0'+milliSeconds;*/
                                   var requiredDateStepOne = [year, month, day].join('-');
                                   var finalDate = requiredDateStepOne+" "+hour+":"+minutues;
                                   return finalDate;
                            }


Recent Post

Databricks Delta table merge Example

here's some sample code that demonstrates a merge operation on a Delta table using PySpark:   from pyspark.sql import SparkSession # cre...